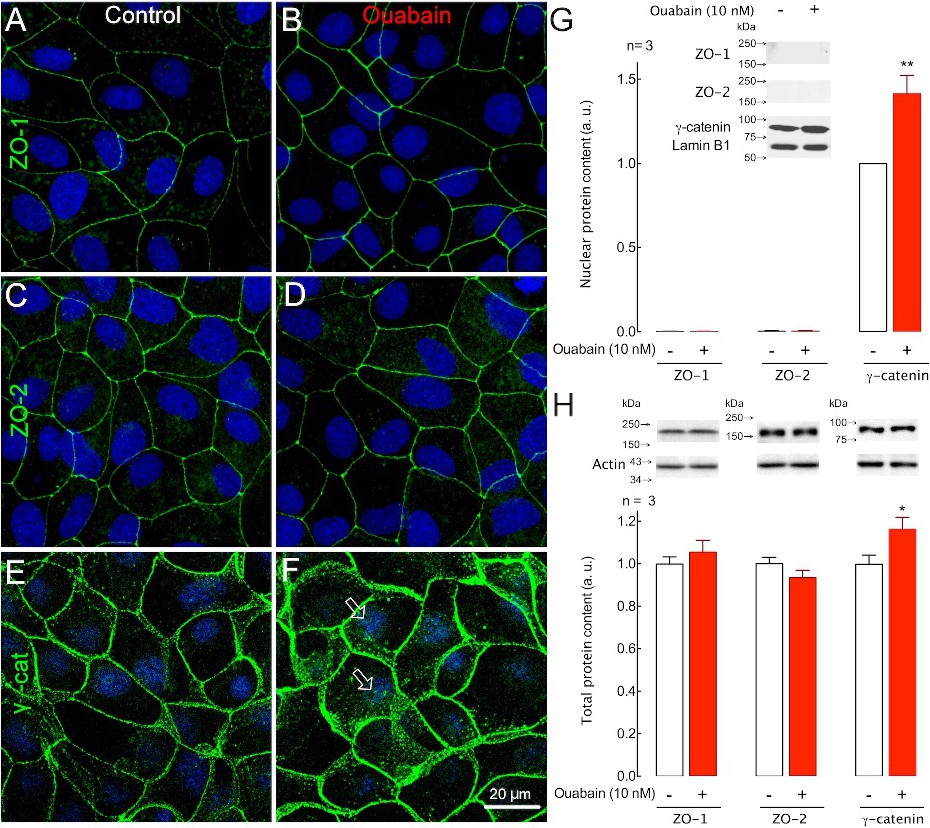
Fig. 3. Ouabain induces γ-catenin translocation into the nucleus. Images show the projection of 30 to 40 optical slices. Immunofluorescence of ZO-1 (A and B, green), ZO-2 (C and D, green) and g-catenin (E and F, green) in confluent monolayers of control MDCK cells (A, C and E) and MDCK cells treated with 10 nM ouabain (B, D and F). Nuclei are stained in blue. The white arrows in F point to nuclear g-catenin. (G) Western blotting and densitometric analysis of ZO-1, ZO-2 and g-catenin in nuclear protein extracts of control cells (white bars) or cells incubated for 8 h with 10 nM ouabain (red bars); gel loading was normalized to lamin B1. (H) Western blotting and densitometric analysis of ZO-1, ZO-2 and g-catenin in cellular and nuclear protein extracts, normalized to actin or lamin B1, respectively, for control (white bars) and ouabain-treated (red bars) cell monolayers. * P<0.05, ** P<0.01, n = 3, t-test of ouabain vs control.